The Mathematical Formulation of the Black Oil Model
Introduction
The black oil model is a generalization of the simple two-phase, two-component TOIL_IMS model. The black oil model is a three phase, three component model such that gas can dissolve in the reservoir oil phase. This implies that, in the case of the reservoir oil phase, more than one phase can contribute to the flow of a component, which extends the structure of the underlying equations, introduced for the formulation of thermal oil:
The model assumes full instant equilibrium between the components in a cell, so that the oil-gas system can exist in two states possible states:
Saturated – there is free gas in the cell, and the oil is saturated, so that its bubble point (the pressure at which gas will come out of solution) is equal to the oil phase pressure.
Undersaturated – there is no free gas in the cell, and the bubble point pressure is less than the oil phase pressure.
In each case, the system of oil, water and gas may be parameterized as a function of three primary variables, these being (\(P_{o}\), \(S_{o}\), \(S_{g}\)) for the saturated case and (\(P_{o}\), \(S_{o}\), \(P_{b}\)) for the undersaturated case. In the main solution arrays, one or other of these two possibilities is held for each cell, and a state variable is maintained to distinguish between the two cases.
The amount of dissolved gas in the oil is commonly parameterized by the solution gas-oil ratio (normally denoted \(R_{s}\)) which is the volume of dissolved gas (measured at surface conditions) divided by the volume of oil (also measured at surface conditions) in the reservoir oil phase. Oil properties such as formation volume factor (volume of oil at reservoir conditions/volume of oil at surface conditions), enthalpy and viscosity will generally be functions of pressure and bubble point.
The variable substitution method was selected in preference to the alternative of using mass or molar density variables, which avoid the need to switch variables but introduce a flash calculation. This was driven by the wish to make best use of Pflotran’s saturation variable formulation, the reduced equation set in the absence of a extra volume balance condition, and greater ease of solution damping with respect to changes in the relative permeability functions.
Phases and Components
When oil and gas are produced from a reservoir, the process can be pictured as:
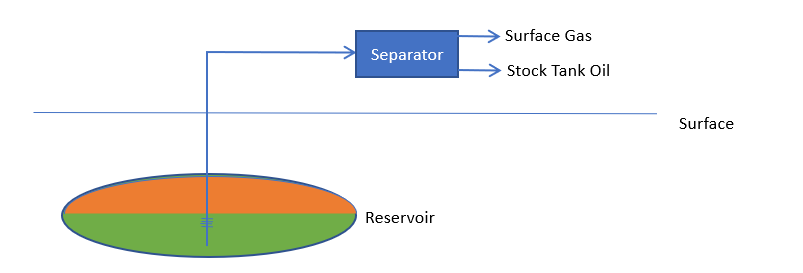
Hydrocarbon from the reservoir is produced through the wells, and is then run through separators, to yield stock tank oil (STO) and surface gas (SG). The black oil model assumes that the nature of the STO and SG remain fixed, and that, as the production always splits into these two fluids, the entire reservoir may be regarded as a combination of these two components.
In the reservoir, of course, hydrocarbon can exist in liquid (reservoir oil, RO) and vapor (reservoir gas, RG) phases. In the basic dissolved gas picture, we further assume that reservoir gas contains only surface gas, whilst reservoir oil contains both stock tank oil and surface gas.
As well as the extra bubble point pressure dependence of the oil properties, the black oil model requires, as data, the saturated solution gas-oil ratio as a function of the saturation pressure, \(Rssat(P_b)\).
Variable Switching
In PFLOTRAN the state of a cell is defined by a number of primary variables, from which other secondary variables are derived. In the case of a saturated cell, these can be (\(P_{o}\), \(S_{o}\), \(S_{g}\)) and for an undersaturated cell we can use (\(P_{o}\), \(S_{o}\), \(P_{b}\)). Other options are, of course, possible, for example (\(P_{o}\), \(S_{o}\), \(R_{s}\)). However, using the bubble point has a number of advantages:
It saves Rssat lookups\(P_{b}\) is a useful output variable\(P_{b}\) appears in the data (e.g. the properties of saturated oil).
With \(P_{b}\), the switching rule is simple:
where \(\varepsilon\) is a small saturation value.
If the bubble point pressure of an undersaturated cell attempts to rise above the oil pressure, it is switched to a saturated state and gas saturation is tracked. If the gas saturation of a saturated cell attempts to fall to less than zero, it is switched to an undersaturated state and bubble point is tracked.
Note that if there is no oil present (e.g. a water-filled cell), the cell is treated as saturated, as the system would otherwise become independent of the bubble point of oil at zero saturation.
Black Oil Table Data
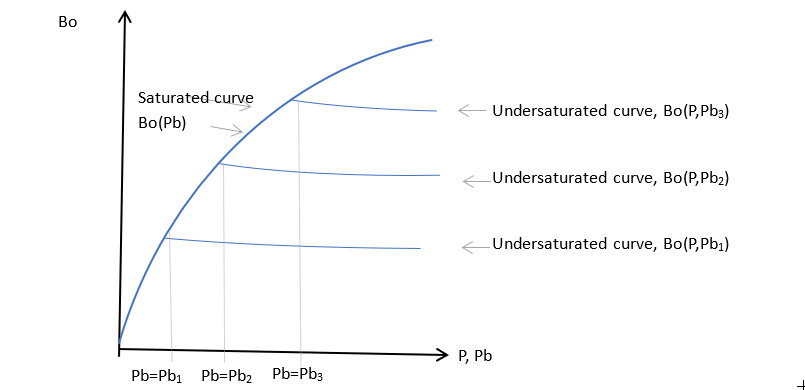
Typical variation of oil formation volume factors
The variation of oil properties with pressure takes the form shown in the figure above. If oil is saturated, as the pressure increases the oil generally swells and becomes less viscous, due to the presence of extra dissolved gas. For pressures above the bubble point of the sample, the oil composition is constant and the undersaturated fluid compresses as the pressure increases and it becomes more viscous. The undersaturated curves may be characterized using a simple compressibility and viscosibility form, with:
\(C_o=-(dB_o/dP)/B_o\)\(C_v=-(d\mu_o/dP)/\mu_o\)
The oil at a given temperature can therefore be characterized using a PVCO table with columns for bubble point, solution gas-oil ratio, oil formation volume factor, viscosity, compressibility and viscosibility.
Similar tables enable the pressure behavior of the gas (PVDG) to be entered.
Pflotran studies generally include temperature variation, and oil PVT data is then required at a number of different temperatures, spanning those expected in the run.